

Sonargraph Product Family
Sonargraph-Enterprise
Our product Sonargraph-Enterprise is collecting metrics for all projects in an organisation in one place. Now it is possible to answer questions like:
- Which projects size increased the most within the last 30 days?
- Which projects have the lowest maintainability?
- Which projects had the biggest relative maintainability changes?
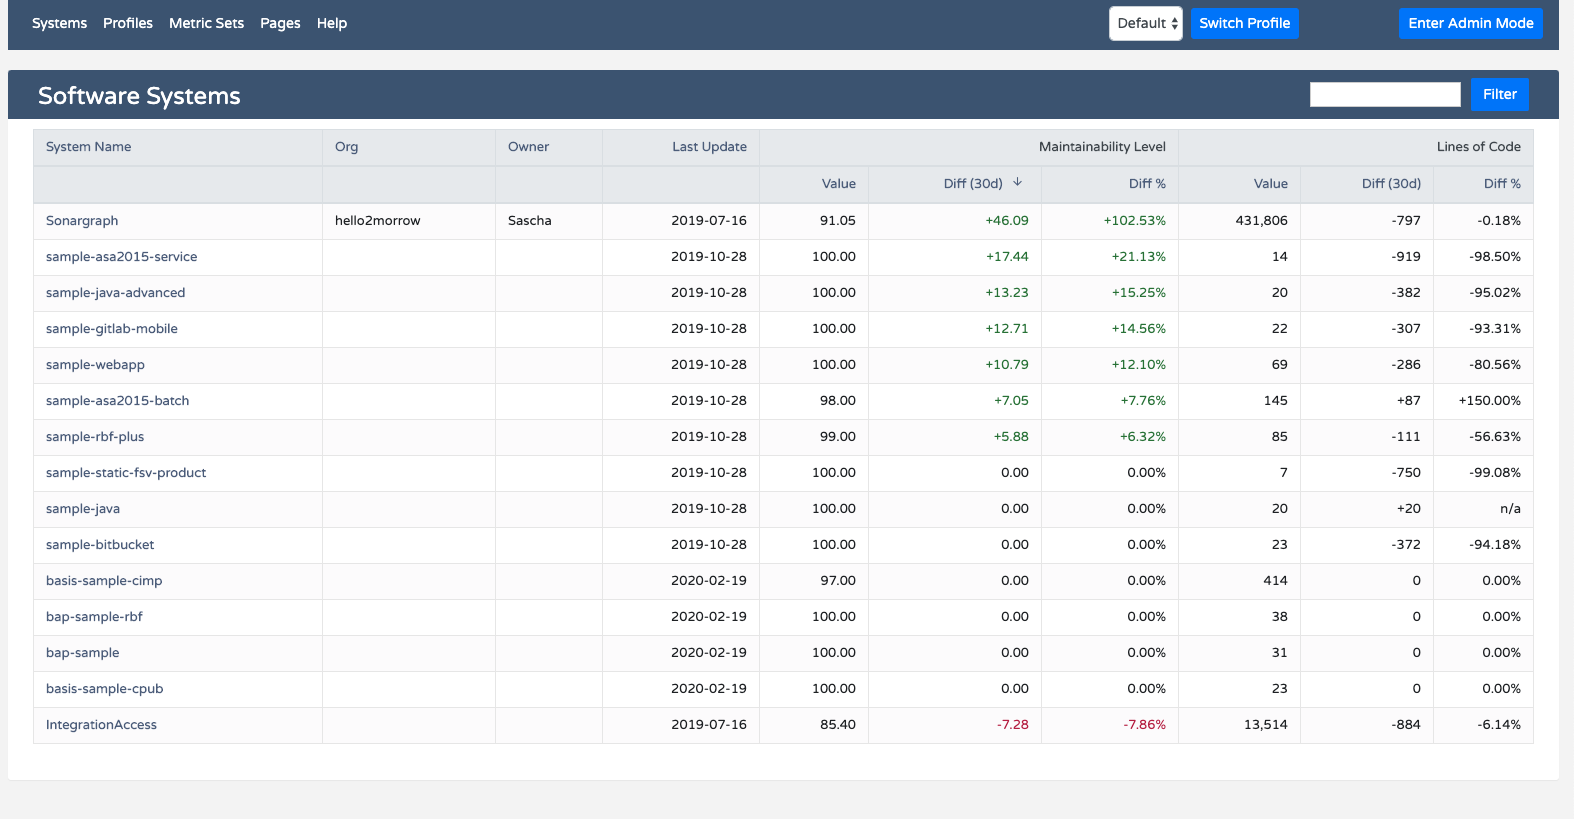 Sonargraph-Enterprise project list (all data are test data)
The screenshot shows the project list with two configurable metrics for each project and the changes of those metrics for a configurable comparison period. You can sort by any of the columns by clicking on the column header. For example you can click on "Diff%" for the metric ML (Maintainability Level) and the list will be sorted by relative change in ML, ascending or descending.
As soon as you click on one of the projects you will see the project landing page, displaying up to 10 metrics for this project and charts displaying the change of two of those metrics over time. You can define different pages with different selections of metrics and you can see a chart for each metric by clicking on the metric in the left part of the viewer.
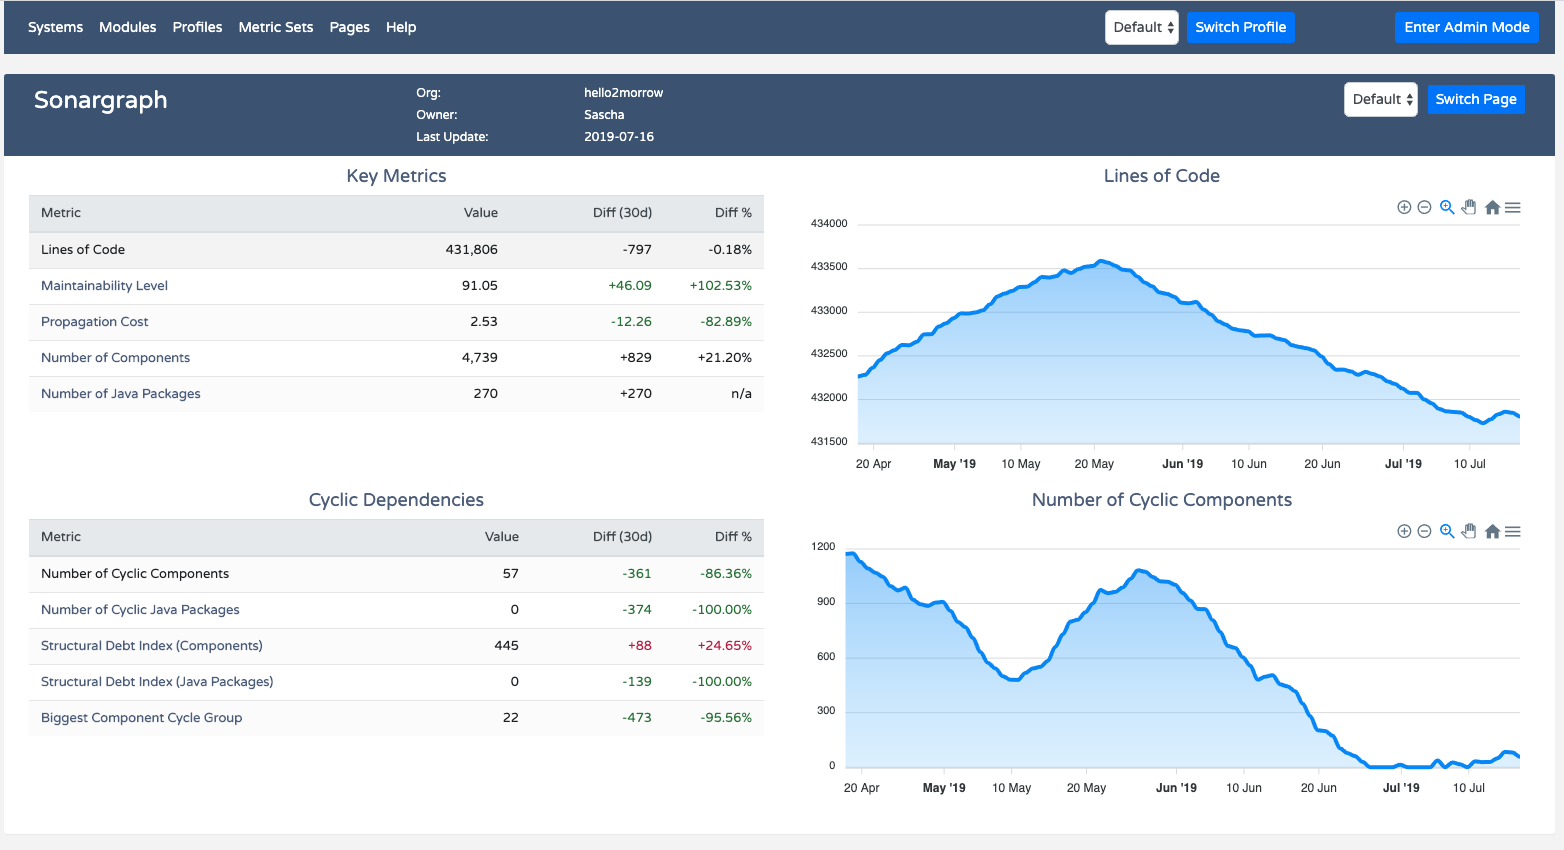 Sonargraph-Enterprise project landing page (all data are test data)
Each project can contain many modules and there are landing pages for modules as well. To feed data into Sonargraph-Enterprise you need to run Sonargraph-Build on all of your relevant projects in the nightly build. Sonargraph-Build will generate a report with all the metrics for your project and all of its modules and this report is uploaded to Sonargraph-Enteprise. The projects do not need to be specially prepared for Sonargraph. Right now we just need Maven, Gradle or Bazel (soon) to execute the data upload. We will also save project snapshots in Sonargraph-Enterprise. The snapshots can then be downloaded by Sonargraph-Architect to do an in-depth analysis of any project available on Sonargraph-Enterprise without needing access to the development environment. The uploaded reports can also be used as baselines in Sonargraph-Architect to find out what exactly has changed since the baseline with respect to issues, metrics and cyclical dependencies.
Custom Metrics
It will be possible to write your own metric sensors. That will allow you to upload metrics to Sonargraph-Enterprise that are not available in Sonargraph. Good examples would be test coverage or number of commits. We plan to publish an example sensor as an open source project on GitHub.
Pricing and Licensing
Sonargraph-Enterprise is available as a free addition for users of our team licenses and architecture team licenses.